top of page


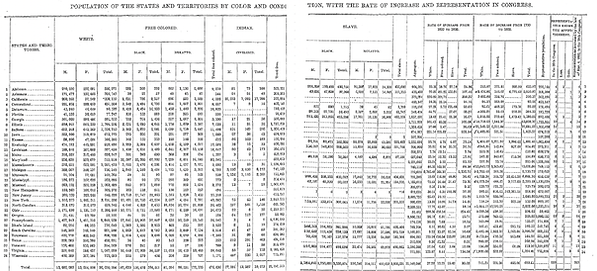
U.S. Census Office, Population of the States and Territories by Color and Condition, with the Rate of Increase and Representation in Congress (1864)
This is a table from the 1864 Census Office report that followed the 1860 Census. It shows data on the population of each state in 1860, which we used to visualize the enslaved population as a percentage of the total population of each slaveholding state. The original table, recreated table, and a 100% stacked bar graph can be found in these spreadsheets.
bottom of page