

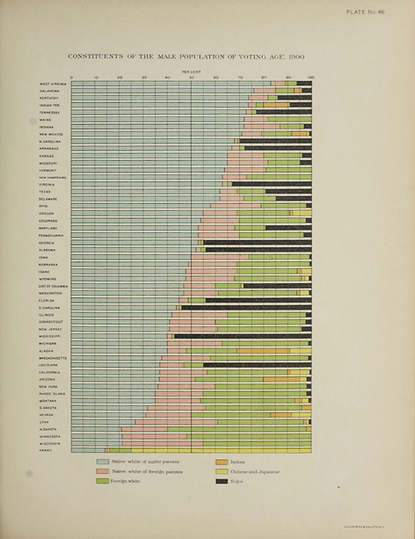
U.S. Census Office, Constituents of the Male Population of Voting Age: 1900 (1903)
This 100% stacked bar graph from the 1903 Statistical Atlas of the United States, compiled under the direction of Henry Gannett, uses 1900 Census data to show the racial composition of each state's male population of voting age.The bars are color-coded, with each color representing a different group. Blue represents “native white of native parents,” and pink represents “native white of foreign parents,” with “native white” referring to white individuals born in the United States. Green represents “foreign white,” or white immigrants; orange represents Indigenous populations; yellow represents Chinese and Japanese populations; and black represents the Black population. Although the graph depicts all men of voting age, not all of these men were permitted to vote at the time—most notably Black men. After the fifteenth amendment was passed in 1870, voting rights were formally extended to men of all races, and Black men were legally permitted to vote. In practice, however, many states circumvented the amendment through state constitutions and laws, including literacy tests, poll taxes, and other restrictions, which prevented most Black men from voting. It was not until the passage of the Voting Rights Act of 1965 that Black men were broadly able to exercise the right to vote in federal, state, and local elections.