

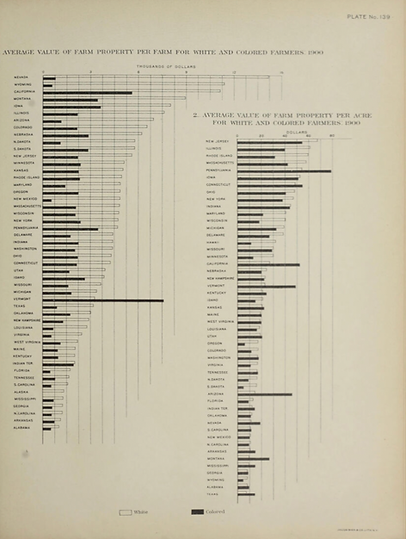
U.S. Census Office, Average Value of Farm Property Per Farm for White and Black Farmers (1903)
This set of bar graphs, included in the 1900 Statistical Atlas of the United States compiled under the direction of Henry Gannett, compares farm values between White and Black farmers. The first graph shows the average value of farm property per farm, with the white bars representing White farmers and the black bars representing Black farmers. Vermont stands out as the only state in which the average farm property value for Black farmers exceeded that of White farmers. Gannett attributed this result to “...the small number of colored farmers, there being but eight, and to the relatively great value of their holdings” (p. 72). This graph also highlights the “...high average value of all farm property per farm of white farmers in Nevada, Wyoming, California, and Montana,” which Gannett explained was “due to the large farms and ranches in these states” (p.72). The second bar graph presents the average value of farm property per acre for White and Black farmers. In 21 states, the average value per acre was higher for Black farmers than for White farmers. Gannett explained that this pattern occurred because “the holdings of colored farmers in these states, though very small in number and in area, included but a small proportion of unimproved land, and were, therefore, much above the average white” (p.72). In other words, although White farmers generally owned more land and more farms, a larger share of their land was unimproved, which lowered its average value per acre.