

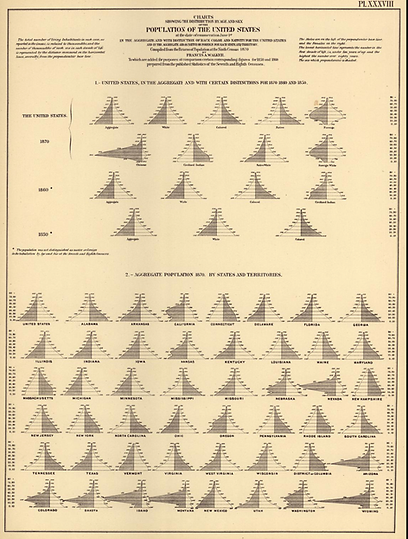
U.S. Census Office, Charts Showing the Distribution by Age and Sex of the Population of the United States (1874)
This series of population pyramids was published in the 1874 Statistical Atlas of the United States based on the Results of the Ninth Census. It illustrates key demographic patterns in the United States based on Census data from 1870. The first set of pyramids represents changes in the U.S. population from 1850 to 1870, disaggregated by race. In each pyramid, the left side represents the male population and the right side represents the female population. The vertical axis displays age groups, with younger ages (beginning with those under ten years of age) at the bottom. While the length of the horizontal bars in most modern population pyramids indicate the percentage of the population represented by each age and sex, each of these bars represents the part per thousand (the per mille of the population). In other words, if you add up the numbers on each side of a population pyramid in this display it will come out to 1000, instead of 100 like it would in the population pyramids we usually see today. Within the top section of the page, the population pyramids for the foreign-born population and for the Chinese population are particularly distinctive. The foreign-born pyramids exhibit a pronounced bulge in the middle age groups, reflecting a higher proportion of working-age adults. This pattern results from the fact that many immigrants arrived in the United States during their prime working years, often with the intention of settling and forming families. The Chinese population pyramid is notable for its disproportionately large male population, a pattern likely associated with male-dominated migration tied to the California Gold Rush.The second set of population pyramids focuses on individual state populations. States such as Arizona, Colorado, Dakota, Idaho, and Wyoming display disproportionately large male populations. These imbalances reflect their location along the frontier of westward expansion, where men were drawn by employment opportunities in male-dominated occupations such as surveying, logging, mining, and farming.