

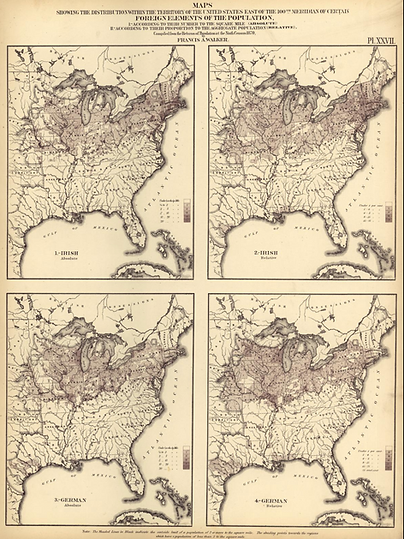
U.S. Census Office, Maps Showing the Distribution Within the Territory of the United States...Certain Foreign Elements of the Population [Irish and German] (1874)
This series of choropleth maps illustrates the distribution of Irish and German immigrant populations across the United States. Darker shading indicates a higher percentage of Irish or German residents within a given area. The first two maps focus on the Irish population, with one showing individuals born in Ireland and the other depicting people descended from Irish immigrants. The United States received a substantial number of Irish immigrants during the nineteenth century, with approximately one-third of all immigrants between 1820 and 1860 coming from Ireland. This surge was driven largely by the Potato Blight of 1845, which resulted in a devastating famine that killed more than one million people. The maps show that Irish immigrants primarily settled in northern states, with especially high concentrations along the East Coast. The next two maps depict the German population, again distinguishing between individuals born in Germany and those descended from German immigrants. Economic opportunity was a primary motivation for German emigration, and between 1830 and the onset of World War I, an estimated 90 percent of German emigrants settled in the United States. Letters sent home by early immigrants often encouraged others to follow. Like the Irish, German immigrants predominantly settled in the North, although the maps also reveal a smaller concentration in Texas.These maps were included in the Statistical Atlas of the United States based on the Results of the Ninth Census, a compilation of data visualizations published in 1874 under the direction of Francis A. Walker to present information collected from the 1870 Census in visual form.